Want impressive Infographics? These 5 online tools make it easy!

Infographics are a fantastic way of sharing visual information. Colourful and using illustrations, infographics are a good way to both explain and entertain your audience. They can also represent any topic, from financial data to comparing product sales and so on.
While you might be thinking that they take a lot of time and money to produce, this isn’t the case. You don’t need to go for a creative digital agency to get your infographic designed as now with these tools you can easily make one on your own..
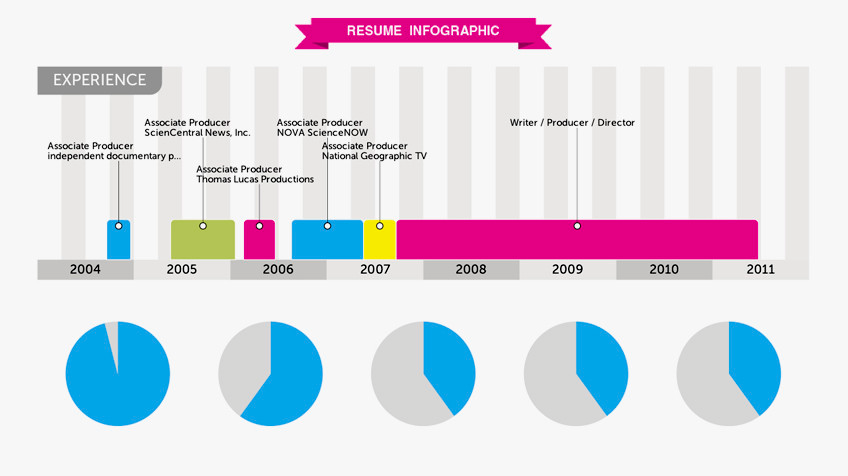
Visualize.Me
One of these amazing tools is Vizualize.Me which allows you to create a beautiful visual resume in just one click. By connecting with your Linkedin profile, it creates a refreshing new spin on the old CV or resume format, making it both easy to read and attractive.
Easel.Ly
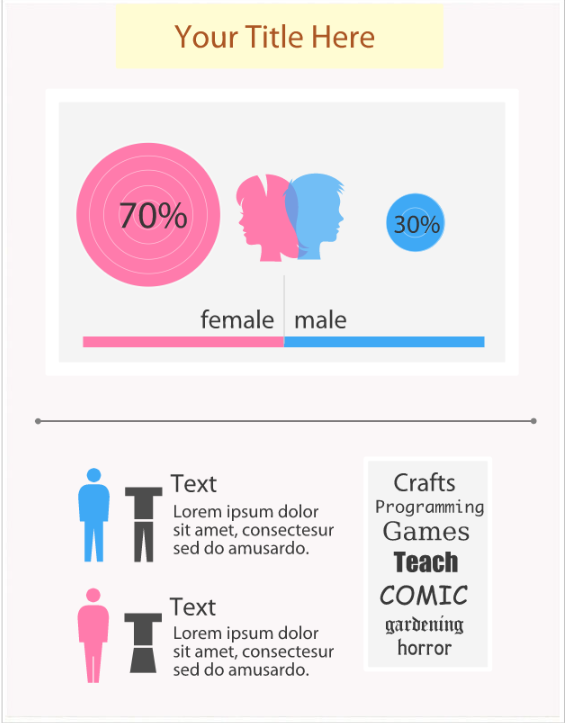
Another fantastic tool is Easel.Ly which allows you to create interesting and eye-catching infographics by simply dragging and dropping features. These are supported by visual themes or ‘vhemes’ where you can drag and drop ideas onto your canvas, making a full infographic. As the name suggests it makes designing your own infographics easy and the only limit is your imagination!
There are dozens of free templates available and you can also use modern graphics which range from people to animals and icons amongst other categories. Graphics and text can be customised and positioned accordingly before being downloaded and shared via a link or an embed code.
Dipity

Create your own digital timeline to show your web content by date and time progression. You can bring history to life with this visual representation of any event. All you have to do is add text and upload images at the click of a button and you’ll have a virtual timeline to share with Facebook friends.
Venngage
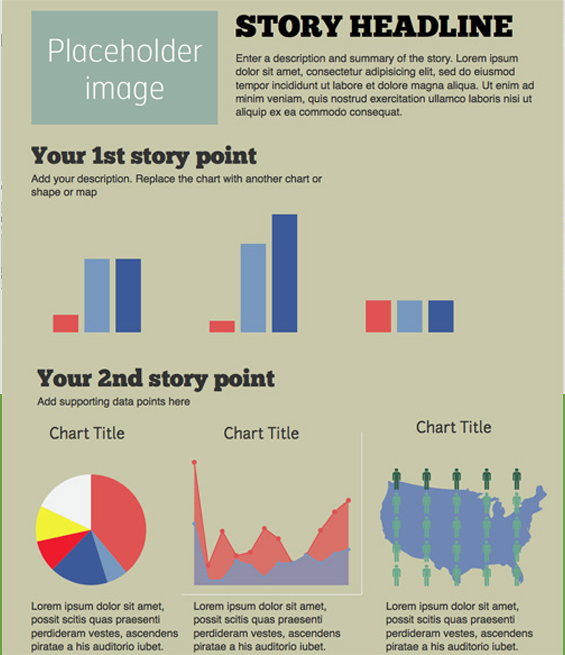
If you want to track the results and see how engaged viewers are with your content, Venngage is the place to create and publish customised infographics. They are attractively designed to be appealing and can make analysing reports easier to understand too.
Piktochart
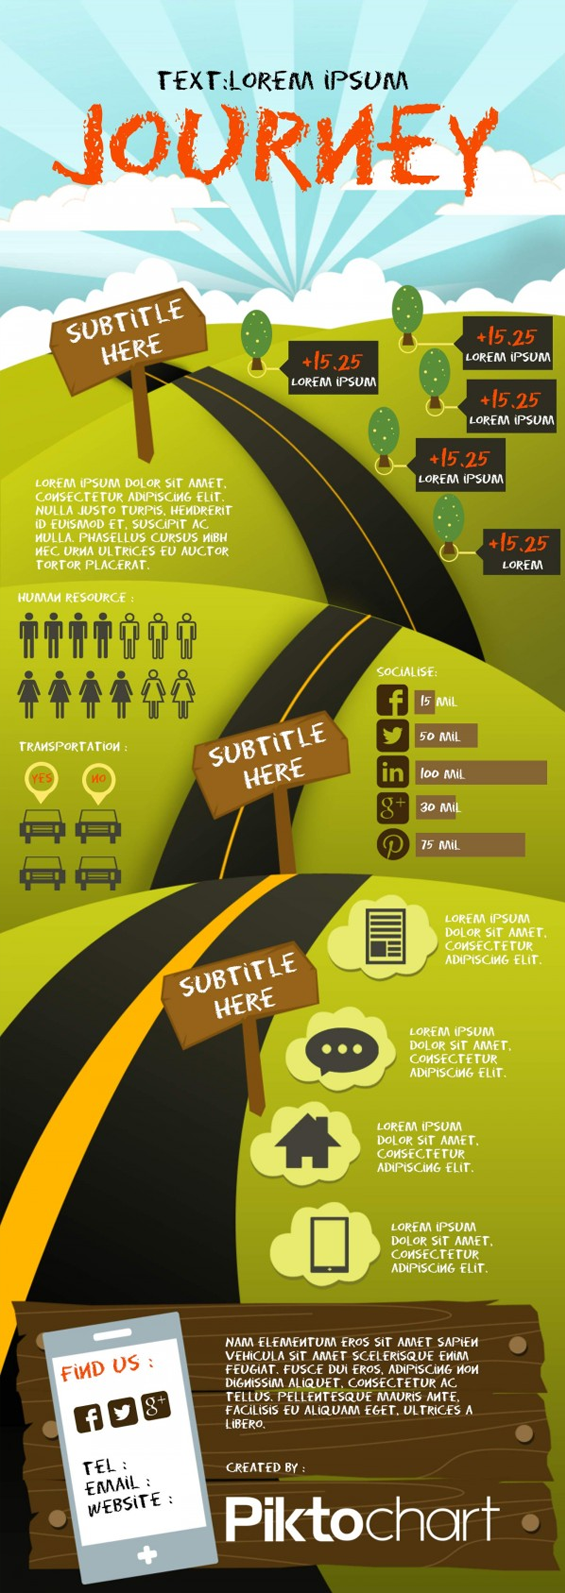
Piktochart is perfect for creating themed stories and engaging your audience with your statistics. They have a couple of free themes but it also gives you customisation options and allows you to upload your own images alongside pre-loaded graphics. You can even use the template’s grid lines to line up items and resize them, as well as to customise texts, styles, fonts, sizes and colours.
All of these tools are an excellent way to get started with creating your own infographics. If you still require help or feel you don’t have resources to do it, it’s recommended that you contact a professional creative digital agency.